Key Takeaways
- Gold remains in focus on Friday after climbing to a two-week high yesterday as bullion bulls grow more confident that the Federal Reserve will cut interest rates later this year.
- According to the CME FedWatch Tool, market participants are currently pricing in a 66% chance of a September rate cut.
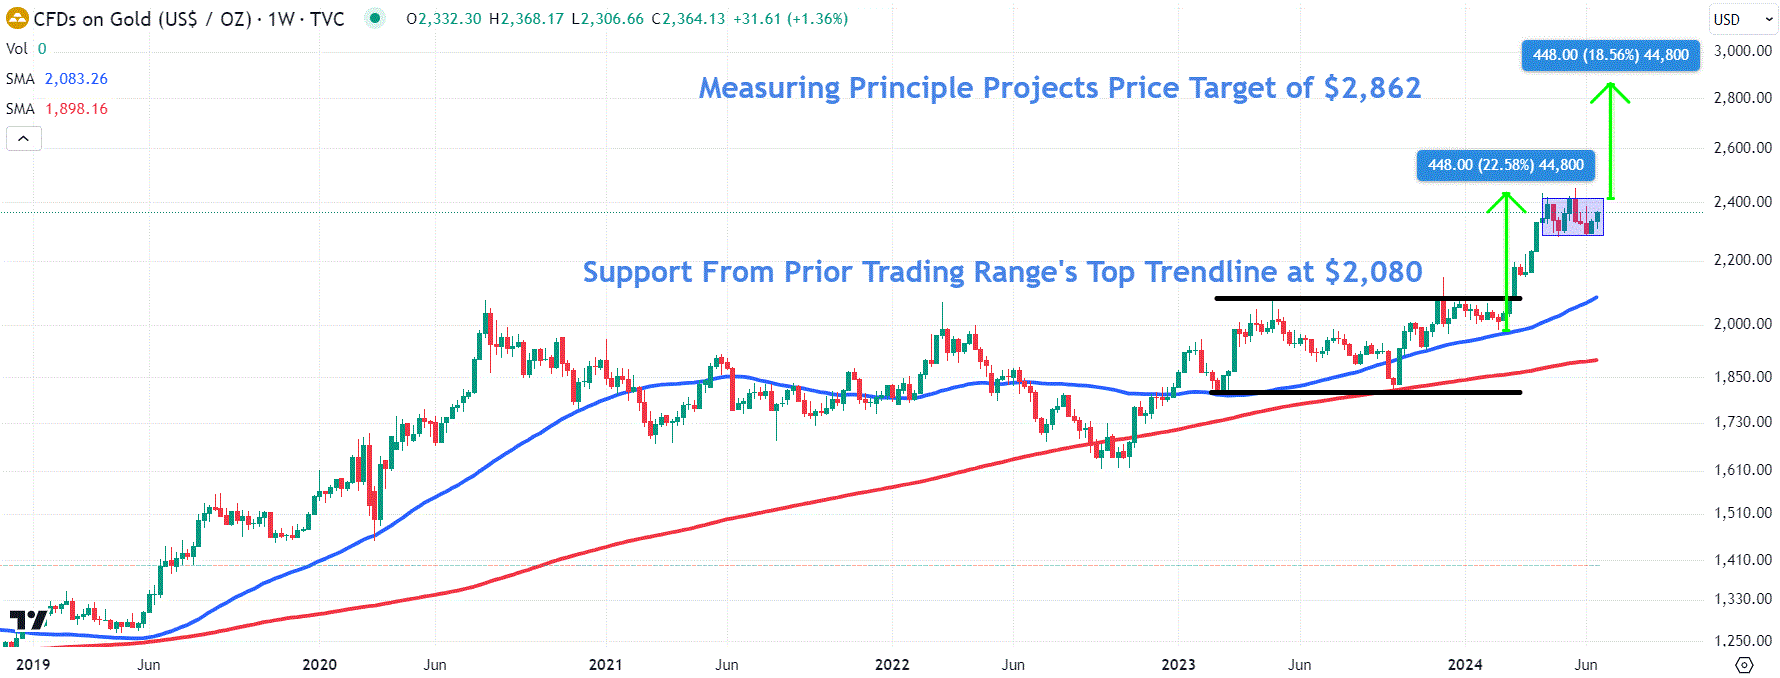
- The measuring principle projects a gold price target of $2,862, while a prior trading range’s top trendline would likely provide support around $2,080.
Gold remains in focus on Friday after climbing more than 1% yesterday to a two-week high, as recent lackluster economic data has boosted hopes among investors that the Federal Reserve will be in a position to cut interest rates later this year.
U.S. government reports last week indicated that inflation is moderating , while data on Tuesday this week showed slowing retail sales . The data paint a picture of cooling economic activity, indicating that the Fed’s policy of high interest rates to combat inflationary pressures has worked as intended.
“The precious metals bulls are more confident late this week, following the weaker U.S. retail sales report earlier this week,” said Kitco senior market analyst Jim Wyckoff.
According to the CME FedWatch Tool , which forecasts rate movements based on fed funds futures trading data, market participants are currently pricing in a 66% chance of a September rate cut.
Investors typically view a decline in interest rates as a positive catalyst for gold prices as it puts downward pressure on the Greenback , making the dollar-priced commodity cheaper for buyers who are using foreign currencies, helping to stimulate demand. Lower rates also reduce the opportunity cost of holding non-yielding assets, such as gold, compared to lower risk investments like fixed-income securities .
Watch These Levels Following a Breakout
Taking a look at the weekly chart, the yellow metal’s price broke out from a year-long trading range in early March. After initially continuing to trend higher, the price has consolidated within a narrow rectangle pattern since mid-April, potentially indicating a short pause in momentum before another move to the upside.
If the gold price breaks above the rectangle’s top trendline to a new record high , investors can determine a price target using the measuring principle . To do this, we calculate the distance of the move that preceded the pattern in dollars and add that amount to the breakout point. In this case, we add $448 to $2,414 that projects a price target of $2,862. Conversely, If the price breaks down from the rectangle, keep an eye on the $2,080 level, an area likely to find support from the prior trading range’s top trendline.
The comments, opinions, and analyses expressed on Investopedia are for informational purposes only. Read our warranty and liability disclaimer for more info.
As of the date this article was written, the author does not own any of the above securities.

