Key Takeaways
- After a bumper start to the year riding Wall Street’s AI wave, AMD shares have slumped as investors question the company’s ability to capture a greater share of the booming AI chip market from tech behemoth Nvidia.
- AMD shares have recently consolidated within a symmetrical triangle, a chart pattern that typically precedes a trending move in the direction of the breakout or breakdown.
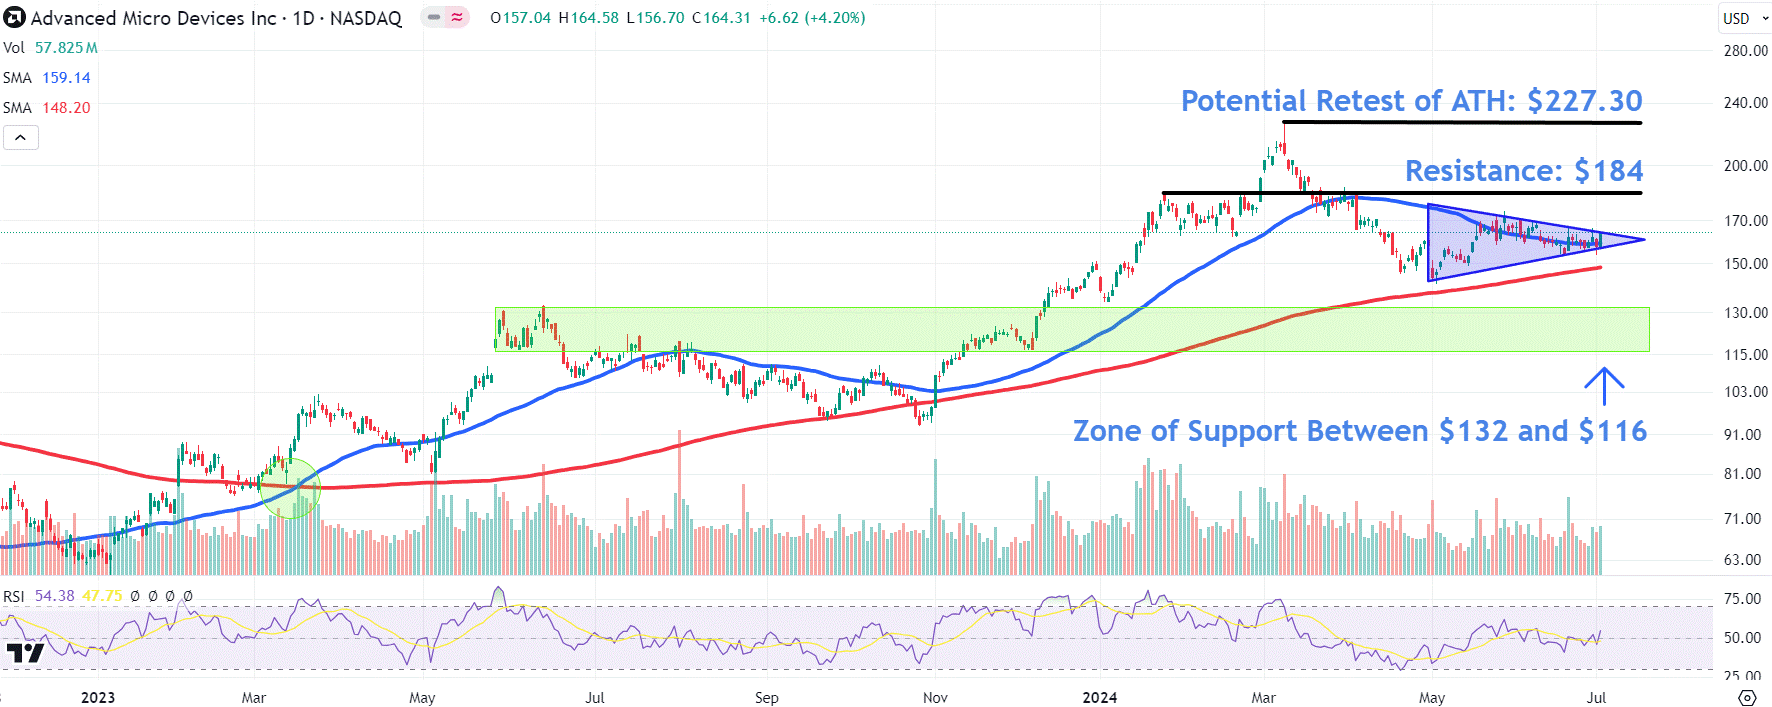
- A breakout in AMD shares may see the price initially climb to $184 before potentially retesting their record high at $227.30.
- A breakdown could see the shares find buying interest from a zone of support between $132 and $116.
After a bumper start to the year riding Wall Street’s artificial intelligence (AI) wave, shares in chipmaker AMD ( AMD ) have slumped as investors question the company’s ability to capture a greater share of the booming AI chip market from tech behemoth Nvidia ( NVDA ).
AMD shares gained 4.2% on Tuesday to close at $164.31, but they’re down 28% from their March high.
Below, we take a closer look at the AMD chart using technical analysis and point out key chart levels to watch out for.
Longer-term, AMD shares have trended mostly higher since the 50-day moving average (MA) crossed above the 200-day MA in March last year to generate a bullish golden cross buy signal. However, the stock fell out of favor with investors between March and early May this year, slumping as much as 38% over that period from its record high.
Consolidation Within Symmetrical Triangle
More recently, the shares have consolidated within a symmetrical triangle , a chart pattern characterized by two converging trend lines with opposite slopes. Typically, a breakout from this formation marks the start of a new bullish trend, while a breakdown signals the start of a bearish trend, especially if the move occurs on higher-than-average trading volume .
Given the price trades above both the 50- and 200-day moving averages towards the symmetrical triangle’s upper trendline, investors should monitor for a near-term breakout, but also have levels in mind if the stock breaks to the downside.
Monitor These Key Levels Amid Breakout From Pattern
Upon a breakout above the pattern, the price could see an initial move to $184, an area on the chart where it may encounter overhead resistance from a horizontal line connecting a range of prices between January and April. A close above this level could give bulls the confidence to retest the stock’s all-time high (ATH) set in early March at $227.30.
If the AMD shares stage a breakdown from the symmetrical triangle, it’s worth monitoring an area on the chart between $132 and $116, a location where the stock would likely attract buying interest from a zone of support from various peaks and troughs formed between May and December last year.
The comments, opinions, and analyses expressed on Investopedia are for informational purposes only. Read our warranty and liability disclaimer for more info.
As of the date this article was written, the author does not own any of the above securities.

