Key Takeaways
- When Netflix reports second-quarter earnings after the bell on Thursday, investors will be focused on subscription growth, advertising revenue, pricing updates, and further details about the streaming giant’s expanding foray into live event sports programming.
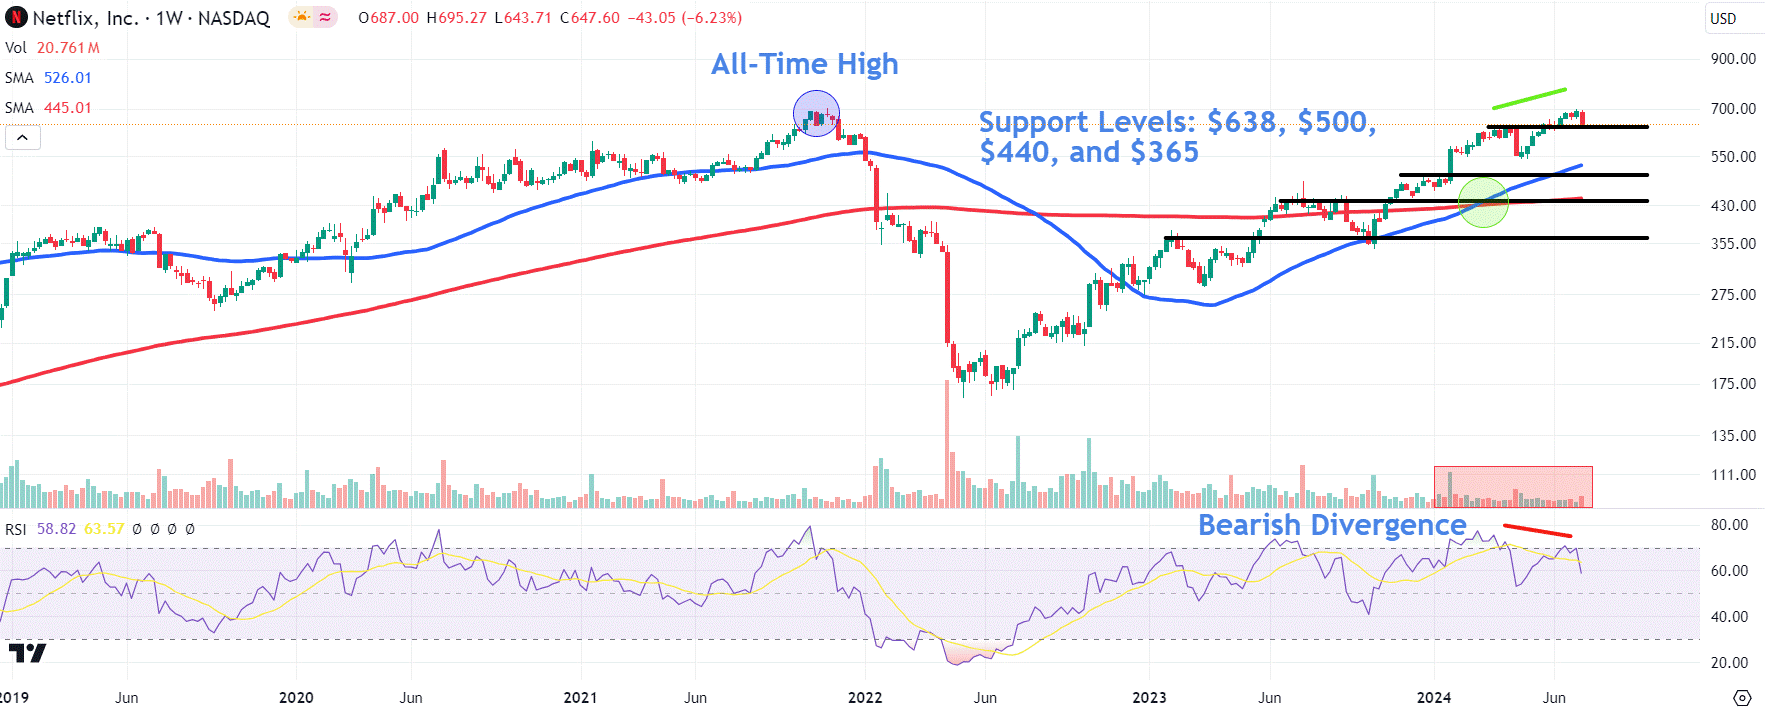
- Several technical indicators, such as below-average volume, a bearish divergence, and a failed attempt to break out to a new record high, point to slowing buyer momentum.
- Netflix shares may find support at key chart levels including $638, $500, $440, and $365.
Netflix ( NFLX ) shares will be on investors’ radar screens this week as the company is slated to report its second-quarter earnings after the bell on Thursday.
Investors will be focused on advertising revenue, pricing updates, and further details about the company’s expanding foray into live event sports programming . Given Netflix’s plans to pivot from reporting subscription metrics next year, analyst will also likely scrutinize these numbers, looking for signs of cooling growth.
Below we take a closer look at the the streaming giant’s weekly chart and point out important technical levels to watch out for amid possible earning’s-related volatility this week.
Technical Indicators Signal Slowing Buying Momentum
Netflix shares have remained in a steady uptrend since May 2022, with the stock generally making higher highs and higher lows over the past two years. Moreover, the 50-week moving average (MA) crossed above the 200-week MA in February to form a bullish golden cross pattern.
However, more recently, several technical indicators suggest a slowdown in buying momentum. Firstly, volumes have remained below average this year compared to 2022 and 2023. Secondly, as the streaming giant’s stock rallied to a multi-year high last week, the relative strength index (RSI) made a relatively lower high to form a bearish divergence. Finally, the stock has attempted to break out to a new record high in recent weeks, but has failed to do so.
Monitor These Chart Levels Amid Profit Taking
It’s worth watching these four key locations on the chart where the stock could attract buying interest during periods of profit taking .
An initial retracement area to monitor sits at $638, where the price could encounter support from a swing high that formed between late March and early April.
Falling below this level could see a decline to the $500 level, an area on the chart likely to find buyers near the psychological number and a period of price consolidation from November 2023 to January this year.
The next lower support area sits around $440 near a horizonal line that connects a range of prices between June and December last year.
A deeper correction could see the stock revisit a trendline linking a 2023 January peak and October trough, near $365,
Netflix shares were up 0.2% at $649.00 in recent premarket trading Monday.
The comments, opinions, and analyses expressed on Investopedia are for informational purposes only. Read our warranty and liability disclaimer for more info.
As of the date this article was written, the author does not own any of the above securities.

